Hammer, inverted hammer and shooting star
Published · Updated · by Hunt4Coin
A hammer is a candle with a small body near the top of its range and a lower wick at least twice the body, formed after a fall; an inverted hammer and a shooting star have the same small body with a long upper wick instead, and the trend before the candle, not its shape alone, decides which name it gets and what it says.
Lesson 10 of the Hunt4Coin Trading Mastery Program · Module 2: Candlesticks · Previous: Lesson 9, doji, spinning top and marubozu · Next: Lesson 11, engulfing and harami patterns.
In Lesson 9 the body was the message: tiny for a doji, large for a marubozu. In this lesson the wick is the message. A long wick is a record of prices that traded during the period but were rejected before the close. Where that wick sits, and what happened before it, is what separates the four candles below.
What they are: one shape, two positions, two contexts
There are really only two shapes here, each with two names depending on the trend before it:
| Shape | After a fall | After a rise | What the wick records |
|---|---|---|---|
| Small body at the top, long lower wick | Hammer | Hanging man | Sellers pushed price well down during the period, buyers brought it back up before the close |
| Small body at the bottom, long upper wick | Inverted hammer | Shooting star | Buyers pushed price well up, sellers brought it back down before the close |
Books use slightly different thresholds. In this course we use these working rules, measured on the candle's own range (high minus low):
- Long wick: at least 2 times the body, and usually 55% or more of the range.
- Other wick: small, ideally under about 15% of the range. A candle with long wicks on both sides is a spinning top or doji (Lesson 9), not a hammer.
- Body: small but visible, roughly 10% to 35% of the range. Colour matters less than position: a green hammer is a little stronger than a red one because the close is also above the open.
- Context: a hammer or inverted hammer needs a fall before it; a hanging man or shooting star needs a rise before it. "A fall" here means several candles of lower closes or a clear move down, not one red candle.
Because the definition depends on the trend, the same candle can be a hammer on a daily chart and a hanging man on a 1-hour chart. Always name it on the timeframe you are reading (Lesson 2).
How to spot them on a chart: six real Bitcoin daily candles
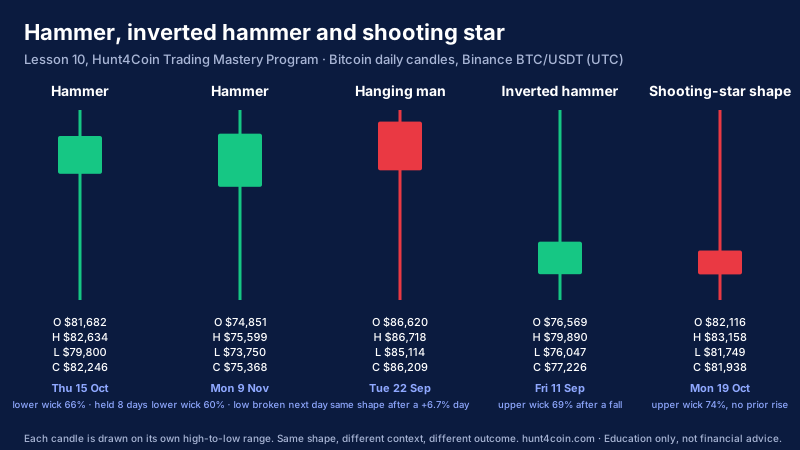
These are Binance BTC/USDT daily candles (UTC close), measured from their open, high, low and close. Five of them are drawn on their own range in the diagram above.
| Day | Open | High | Low | Close | Body (% of range) | Upper / lower wick | Volume (BTC) | Shape and context |
|---|---|---|---|---|---|---|---|---|
| Fri 11 Sep | $76,568.73 | $79,890.00 | $76,046.58 | $77,225.70 | $656.97 green (17%) | 69% / 14% | 19,713 | Inverted hammer after a 3.2% fall |
| Tue 22 Sep | $86,620.01 | $86,717.60 | $85,114.00 | $86,208.56 | $411.45 red (26%) | 6% / 68% | 21,328 | Hanging man after a 6.7% rise |
| Thu 15 Oct | $81,682.02 | $82,634.30 | $79,800.00 | $82,245.93 | $563.91 green (20%) | 14% / 66% | 22,563 | Hammer after a 5.6% fall |
| Mon 19 Oct | $82,116.00 | $83,158.00 | $81,748.85 | $81,938.40 | $177.60 red (13%) | 74% / 13% | 12,792 | Shooting-star shape, but no rise before it |
| Mon 9 Nov | $74,851.44 | $75,599.22 | $73,750.00 | $75,368.41 | $516.97 green (28%) | 12% / 60% | 15,687 | Hammer after a 7.0% fall |
| Sun 15 Nov | $64,150.01 | $66,132.01 | $62,006.00 | $65,351.05 | $1,201.04 green (29%) | 19% / 52% | 29,231 | Near-hammer (lower wick 1.8× body) after a 13.3% fall |
Reading them the way a trader reviews past charts:
- 15 October, a hammer that held. Bitcoin had closed at $86,530 on 4 October and at $81,682 on 14 October, a fall of about 5.6%. On 15 October it traded down to $79,800, then closed at $82,246, with a lower wick 3.3 times the body on about 23% more volume than the day before (22,563 BTC against 18,308). The low of $79,800 was not traded again for eight days, and on 21 October Bitcoin closed at $84,093 with a high of $84,898. The wick marked a level where selling had been absorbed, and for a while it held.
- 9 November, a hammer that failed the next day. Bitcoin had fallen from a $80,504 close on 4 November to $74,851 on 8 November, about 7%. The 9 November candle went down to $73,750 and closed at $75,368, lower wick 2.1 times the body, on 66% more volume than 8 November. It looked like the 15 October candle. On 10 November price fell to $72,727 and closed at $73,796, below the hammer's low. That close cancelled the reading. By 14 November Bitcoin closed at $64,150. Same shape, opposite outcome: this is why the low of a hammer is the line that matters, not its name.
- 22 September, a hanging man. The day before, Bitcoin had risen 6.7% in one candle, from $81,178 to $86,620. On 22 September it dipped to $85,114 and closed at $86,209 with a lower wick 2.7 times a red body. In a falling market this would be called a hammer; after a strong rise it is a hanging man, a sign that sellers were able to push price down hard during the day. It is only a warning until it is confirmed: on 23 September Bitcoin closed at $84,398, below the hanging man's low.
- 11 September, an inverted hammer. After a fall from $79,112 (6 September close) to $76,569 (10 September close), buyers pushed price as high as $79,890, and sellers took it back to $77,226 by the close: an upper wick 4.1 times the body. Its lower wick (14% of the range) is a little long for a textbook example. What followed was mixed: three days inside or just above the body, a close below its low on 15 September ($75,644), then a close above its high on 18 September ($80,884). An inverted hammer shows buyers testing higher; on its own it did not settle anything here.
- 19 October, a shooting-star shape with no uptrend. The upper wick was 74% of the range and 5.9 times the body, a perfect shape. But the three days before it closed at $81,616, $81,491 and $82,116: no rise, just a sideways drift after the 15 October hammer. A shooting star needs a move up to reject. The next two days closed at $83,028 and $84,093, the second one above the candle's high. Shape without context is not a pattern.
- 15 November, a near-hammer. After the fall from $74,015 (11 November close) to $64,150 (14 November close), about 13.3%, the Sunday candle traded down to $62,006 and closed at $65,351. Its lower wick was 1.8 times the body and its upper wick 19% of the range, so by our rules it is close to a hammer but not one. Its low held on 18 November (low $62,063), and on 19 November Bitcoin traded down to $61,428 and closed at $61,987, below it (20 November story). A long wick is a level, and a level can be broken.
How traders use them
- As a location, not a trigger. The useful part of a hammer is its low: the price where selling was rejected for that period. The useful part of a shooting star is its high. Traders mark those levels and watch what the next candles do around them.
- Wait for confirmation. A common rule is to act only if the next candle closes beyond the pattern's body in the expected direction: above the hammer's close, below the shooting star's close. Some traders wait for a close beyond the high (hammer) or low (shooting star) of the pattern candle. The 22 September hanging man was confirmed on 23 September; the 19 October shooting-star shape never was.
- Prefer them at levels that already mattered. A hammer whose wick pierces a previous low or a round number and closes back above it (support and resistance are covered in Module 3 of the Trading Mastery Program) carries more weight than one in the middle of nowhere.
- Check volume. Both hammers above came on higher volume than the day before. That says more people traded at the rejected prices, but as 9 November shows, it does not guarantee the level holds.
- Match the timeframe to the plan. A daily hammer's low may be $2,000 or more below the close. If that distance is too large for your account, the pattern is not tradeable for you on that timeframe, however clean it looks.
When they fail: common mistakes
- Naming the shape without the trend. A long lower wick after a rise is a hanging man, not a bullish hammer. A long upper wick in a sideways market (19 October) is just a wick.
- Acting before the close. At 18:00 UTC a candle can look like a perfect hammer and then close as a red marubozu. On Binance the daily candle closes at 00:00 UTC; read it after that.
- Ignoring the next candle. On 10 November the close below the hammer's low cancelled the reading within 24 hours. Traders who keep a hammer "in mind" after its low is broken are holding an opinion, not a setup.
- Counting wicks on tiny candles. On 1-minute and 5-minute charts, hammers and shooting stars appear all the time and carry little information. Their weight grows with the timeframe and with the size of the candle relative to recent ones.
- Forgetting the fees and spread. A tight stop just below a hammer's low on a thin weekend book can be filled worse than planned (Lesson 4, Lesson 6).
- Expecting a reversal of the whole trend. Even when a hammer holds, it often marks a pause or a bounce inside a larger move. The 15 October low held for eight days; the larger decline continued afterwards.
Risk management
- Write the invalidation first. For a hammer, the reading is wrong on a close below its low. For a shooting star, on a close above its high. Put the stop a little beyond that level, outside the wick, not inside it.
- Size from the stop distance. Take the 15 October hammer: a trader reading it as rejection, entering near the $82,246 close with a stop just under the $79,800 low (about $2,550 away), risking 1% of a $10,000 account ($100), could hold about 0.039 BTC (about $3,230 of Bitcoin). The same rule on the 9 November hammer (entry near $75,368, stop near $73,650, about $1,720 away) gives about 0.058 BTC; the stop was hit on 10 November for the planned $100 plus fees, while the close on 14 November was about 15% lower. The stop and the size did their job even though the pattern failed.
- Plan exits as scenarios, not targets. Decide in advance what you will do if price reaches the last swing high, if it stalls for three days, and if it closes back inside the wick. None of these is a prediction; they are rules written before the trade.
- Don't stack two readings on one level. If a hammer and an indicator signal sit on the same low, they are one idea, not two confirmations. Keep the risk at 1% for the idea.
Practice drill with Hunt4Coin's free tools
- Open the Bitcoin chart on daily candles and find 11 and 22 September, 15 and 19 October, and 9 and 15 November. Check the table's prices with the crosshair.
- For the last 60 daily candles, measure each candle's body and wicks as a percentage of its range. Label every hammer, hanging man, inverted hammer and shooting star using this lesson's rules, writing the trend before each one.
- For each one, record what the next candle did: closed beyond the body in the expected direction, closed through the wick's end, or stayed inside. Do this for at least 20 examples before drawing any conclusion.
- Add volume under the chart and note whether each pattern came on more or less volume than the day before.
- Use the crypto screener to choose three coins from the top 100 that are near their 30-day lows, and repeat step 2 on their 4-hour charts.
- Plan one paper trade on a hammer you find, with the stop below its low and the size set to 1% of the paper balance, and set a price alert at the hammer's low so you see a break without watching the chart. Then test a simple hammer rule over months of data in the backtester with fees switched on.
FAQ
What is a hammer candlestick in crypto? A hammer is a candle with a small body near the top of its range and a lower wick at least twice the size of the body, formed after a fall. It shows sellers pushed price down during the period and buyers brought it back before the close. Traders treat its low as the level that should hold and usually wait for the next candle to confirm.
What is the difference between a hammer and a hanging man? They have the same shape. A hammer forms after a fall and suggests selling was rejected; a hanging man forms after a rise and warns that sellers could push price down hard during the period. On Bitcoin's daily chart, the 22 September 2026 hanging man came after a 6.7% rise and was followed by a close below its low the next day.
Is a shooting star always bearish? No. A shooting star is a long upper wick after a rise, and it only shows that higher prices were rejected for one period. Without a rise before it, it is just a candle with a long wick: on 19 October 2026 a shooting-star shape on Bitcoin's daily chart was followed by two higher closes. Traders wait for a close below the body before treating it as a warning.
Lesson 10 summary
A long wick records prices that were tried and rejected. A small body at the top with a long lower wick is a hammer after a fall and a hanging man after a rise; a small body at the bottom with a long upper wick is an inverted hammer after a fall and a shooting star after a rise. Measure the wick against the body (at least 2 times), check the trend before it, read it only after the close, and let the end of the wick be your invalidation. On Bitcoin's daily chart the 15 October hammer held for eight days, the 9 November hammer failed the next day, and the 15 November near-hammer's low was closed beneath on 19 November: the pattern gave a level, and the stop decided the risk. Next lesson: engulfing and harami, the first two-candle patterns.
Education only, not financial advice. Trading crypto, stocks, metals, oil or forex is risky; never trade money you can't afford to lose.