The dollar (DXY), gold and Bitcoin
Published · by Hunt4Coin
The US dollar index (DXY) measures the dollar against a basket of six major currencies, and because gold and Bitcoin are priced in dollars and pay no interest, a dollar that rises on higher expected US interest rates often coincides with falling gold and Bitcoin prices, though the link is loose, changes over time and breaks on many single days.
Lesson 61 of the Hunt4Coin Trading Mastery Program · Module 8: Markets and the world · Previous in this module: Lesson 60, how stocks, metals, oil, forex and crypto differ (coming soon) · Next in this module: Lesson 62, risk-on, risk-off and the stock–crypto correlation (coming soon) · Next in the course: Lesson 10, hammer, inverted hammer and shooting star (coming soon).
So far this course has taught you to read one chart: candles, timeframes, pairs, orders and fees. Module 8 widens the view. Crypto does not trade in a vacuum: when the world's reserve currency moves sharply, it changes the price of almost everything quoted in it. This lesson comes earlier than its number because the last two weeks gave a textbook example. Between 4 and 18 November 2026 the dollar index climbed to a 19-month high while Bitcoin fell more than a fifth and gold fell to its lowest since September 2025. We will read that period day by day, including the days the pattern did not hold.
What it is: the dollar index and why it matters
The US Dollar Index (DXY), published by ICE, measures the US dollar against six currencies with fixed weights: the euro (57.6%), Japanese yen (13.6%), British pound (11.9%), Canadian dollar (9.1%), Swedish krona (4.2%) and Swiss franc (3.6%). It was set at 100 in March 1973. A reading of 103.82 means the dollar is worth about 3.8% more against that basket than at the start; a rise from 101.4 to 103.82 means the dollar gained about 2.4% against it.
Two things to notice:
- DXY is mostly the euro. With a 57.6% weight, a move in EUR/USD drives most of the index. It is a measure of the dollar against other rich-world currencies, not against everything.
- DXY trades on weekdays. Forex trades around the clock from Monday to Friday; crypto and tokenised gold such as PAXG trade every day. On weekends, Bitcoin moves with no dollar index to compare against.
Why a stronger dollar can weigh on gold and Bitcoin
There are three common explanations, and they overlap:
- Price arithmetic. Gold and Bitcoin are quoted in dollars. If the dollar buys more euros and yen, the same ounce of gold or the same Bitcoin needs fewer dollars to stay worth the same in those currencies.
- Interest rates and opportunity cost. The dollar usually rises when markets expect higher US rates. Gold and Bitcoin pay no interest, so when a Treasury bill pays more, holding them costs more in income given up.
- Liquidity and risk appetite. Rising rates and a firm dollar tighten financial conditions. Leveraged positions become more expensive to carry, and traders cut risk, often starting with the most volatile assets.
None of these is a law. Gold can rise with the dollar when investors seek safety from a war or a banking scare, and Bitcoin sometimes trades on its own news (ETF flows, a hack, a regulation vote) regardless of the dollar.
How to spot it on a chart: 4 to 18 November 2026
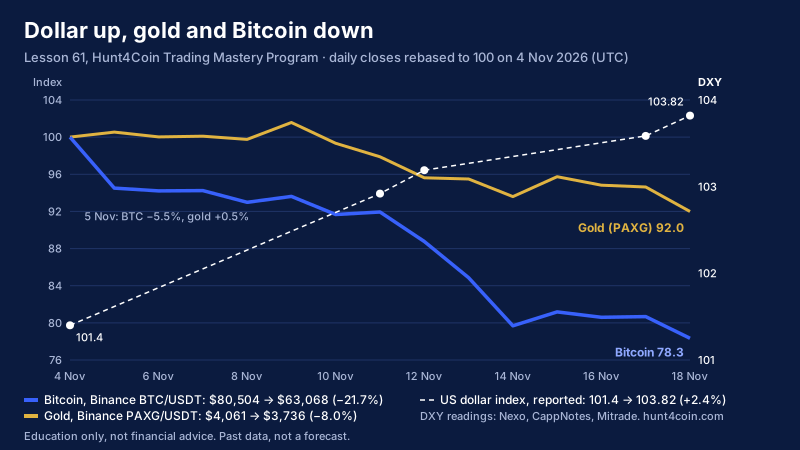
The chart above rebases two crypto-market series to 100 on 4 November: Bitcoin (Binance BTC/USDT daily close) and tokenised gold (Binance PAXG/USDT, a token backed by one troy ounce of gold, which tracks the gold price closely). The dashed line shows dollar index readings reported in our daily news.
| Date (2026) | Dollar index (reported) | Bitcoin close (Binance) | Gold token close (PAXG) | What happened |
|---|---|---|---|---|
| Tue 4 Nov | about 101.4, a one-month low (Nexo) | $80,504 | $4,061 | US midterm results; a short squeeze lifted Bitcoin |
| Wed 11 Nov | 102.92 | $74,015 | $3,975 | A day after hotter-than-expected October inflation |
| Thu 12 Nov | 103.19, highest since April 2025 (CappNotes) | $71,460 | $3,883 | Dollar up, gold futures −2.88%, Bitcoin −3.45% |
| Tue 17 Nov | 103.586 early in the day | $64,947 | $3,843 | December hike about 96% priced |
| Wed 18 Nov | about 103.82 (Mitrade) | $63,068 | $3,736 | Fed minutes: almost all officials saw further hikes as likely appropriate |
Over the whole period the dollar index rose about 2.4%, gold (PAXG) fell about 8.0% and Bitcoin about 21.7%. That is the classic picture: a stronger dollar on rising rate expectations, with gold and Bitcoin both lower and Bitcoin moving much further.
The days the link broke
Read the same days more closely and the neat story gets messier, which is the most useful part of this lesson.
- 5 November: Bitcoin fell 5.5% while gold rose 0.5%. The dollar was not the driver that day; the Nasdaq 100 had its worst session since March 2020, and Bitcoin traded like a high-risk technology asset, not like gold.
- 13 November: Bitcoin fell 4.4% while gold was almost flat (−0.1%), as roughly $1.6 billion of crypto positions were liquidated (CoinDesk). A crypto-specific leverage flush did most of the damage.
- 15 November (a Saturday): Bitcoin rose 1.9% and PAXG 2.3% with no dollar index trading at all.
- 18 November: both fell about 2.8% on the same day as the Fed minutes, the closest match of the period.
Across the 22 daily moves from 27 October to 18 November, the correlation between Bitcoin's and PAXG's daily returns was about 0.54: positive, but far from a lockstep. A trader who treated "dollar up = Bitcoin down" as a rule would have been right about the direction of the fortnight and wrong about many individual days.
How traders use it
- As context, not a trigger. Traders check whether the dollar and yields are rising or falling before reading a crypto chart. A breakout attempt on Bitcoin while the dollar is making new highs is treated with more suspicion, and they wait for a daily close and volume (Lesson 9).
- To explain a move after it happens. When gold, oil, silver and Bitcoin all fall on the same day, a dollar or rate story is the first thing to check; when only Bitcoin falls, look for crypto news (liquidations, ETF outflows, a hack).
- Around scheduled events. Rate decisions, minutes, inflation and jobs data move the dollar first. Traders mark levels before the release and avoid trading the first minutes, when spreads widen (Lesson 4).
- Higher timeframes first. The relationship is clearer on daily and weekly charts than on 5-minute charts, so traders use it on the timeframe they are planning on (Lesson 2).
When it fails: common mistakes
- Treating correlation as a rule. A 0.54 correlation still leaves many days in which the two moved differently. It describes the past window, not the next day.
- Ignoring what the dollar is moving against. A DXY rise driven by euro weakness (European news) is not the same as one driven by higher US rate expectations.
- Forgetting weekends. DXY doesn't trade on Saturday and Sunday, and Bitcoin often makes its biggest moves then, on thinner order books.
- Using one data point. "The dollar hit a high and Bitcoin fell" is a story; check the rest of the week before believing it.
- Stretching it to forecasts. "The dollar will rise, so Bitcoin will fall" is a prediction built on a loose relationship. This course never makes calls like that, and you shouldn't build trades on them.
Risk management
- Size for the regime. When macro news is driving several markets at once, daily ranges widen. Bitcoin's daily ranges (high to low) of 12–18 November were about $1,800 to $5,100. If your stop must sit beyond a recent swing, a wider stop means a smaller position: risking 1% of a $10,000 account ($100) with a $2,000 stop allows about 0.05 BTC, not 0.1.
- Define invalidation on the chart you trade. A view built on the dollar is only a view; your stop belongs beyond a level on the Bitcoin chart (for example below the $62,006 and $62,063 lows of 15 and 18 November), and your size comes from that distance.
- Stand aside around releases. Minutes, CPI and rate decisions can move price in both directions within minutes. Many traders close or reduce positions before them, or wait for the first 15-minute or 1-hour candle to close.
- Avoid stacking the same bet. Being long Bitcoin and long gold at the same time while the dollar is rising is closer to one large bet than two small ones.
- Leverage magnifies macro days. On days like 13 and 14 November, liquidations fed the move (Lesson 7).
Practice drill with Hunt4Coin's free tools
Hunt4Coin's charts and tools cover crypto, so for the dollar itself use the reported figures in our daily news and the dollar index readings in your broker's or a financial news site's chart.
- Open the Bitcoin and PAX Gold pages on daily candles and find 4, 5, 12, 13, 15 and 18 November 2026. Check the closes in this lesson's table with the crosshair.
- Make your own table of the last 20 daily closes for both, work out each day's percentage move, and mark the days they moved in opposite directions. Write the reason you find in the news archive next to each.
- For each day with a scheduled US release (CPI, Fed minutes, jobs), note the Bitcoin daily range and compare it with the average range of the previous five days.
- In the crypto screener, check how many top-100 coins have a 1-hour or daily RSI below 30 on a day the dollar makes a new high; then read the weekly RSI crossings dataset to see how unusual that is.
- Plan one paper trade on Bitcoin with the invalidation below the November lows and the size calculated from that distance at 1% risk, and set a price alert at the level instead of watching the next data release live.
- Before testing any rule that mixes macro and price, run the price part in the backtester with fees switched on, and remember a backtest cannot know what the dollar did.
FAQ
Does a strong dollar mean Bitcoin goes down? Not reliably. A dollar that rises on higher expected US interest rates has often coincided with weaker Bitcoin and gold, as between 4 and 18 November 2026, when the dollar index rose about 2.4% and Bitcoin fell about 21.7%. But on many single days the two moved independently, and crypto-specific news can dominate. It is context, not a signal.
What is the DXY? The US Dollar Index, published by ICE, measures the US dollar against six currencies: the euro (57.6% weight), Japanese yen, British pound, Canadian dollar, Swedish krona and Swiss franc. It started at 100 in March 1973, so 103.82 means the dollar is about 3.8% stronger against that basket than then.
Is Bitcoin digital gold? Sometimes it trades with gold and sometimes like a technology stock. In November 2026 their daily returns had a correlation of about 0.54, and on 5 November Bitcoin fell 5.5% while gold rose. Treat the label as a description of some periods, not a rule.
Lesson 61 summary
The dollar index measures the dollar against six major currencies, mostly the euro. Because gold and Bitcoin are priced in dollars and pay no interest, a dollar rising on higher expected US rates often coincides with falling gold and Bitcoin, as from 4 to 18 November 2026 (DXY about 101.4 to 103.82, gold token −8.0%, Bitcoin −21.7%). The link is loose: on 5 and 13 November Bitcoin fell for its own reasons while gold held, and on weekends there is no dollar index at all. Use the dollar as context, put your invalidation on the chart you trade, size from that distance, and stand aside around scheduled releases. Next in the course: Lesson 10, the hammer, inverted hammer and shooting star.
Education only, not financial advice. Trading crypto, stocks, metals, oil or forex is risky; never trade money you can't afford to lose.
Sources
- ICE: U.S. Dollar Index (USDX) contract and basket weights
- Binance: BTC/USDT and PAXG/USDT daily candles, 27 October–18 November 2026 (read 19 Nov 2026, 05:05 UTC)
- Nexo: Markets Today, November 4, 2026
- CappNotes: Closing Look, Thursday, November 12, 2026
- CoinDesk: Bitcoin falls below $70,000 as dollar surges and $1.6 billion liquidated (13 Nov 2026)
- Mitrade: Gold breaks 14-month low on hawkish Fed minutes (19 Nov 2026)