Engulfing and harami patterns
Published · by Hunt4Coin
An engulfing pattern is two candles where the second candle's body completely covers the first candle's body in the opposite colour, and a harami is the reverse, a small second body that fits inside a large first body; the first shows one side taking over within a single period, the second shows a strong move pausing, and neither says anything until the candles after it confirm or cancel it.
Lesson 11 of the Hunt4Coin Trading Mastery Program · Module 2: Candlesticks · Previous: Lesson 10, hammer, inverted hammer and shooting star · Next: Lesson 12, piercing line and dark cloud cover (coming soon).
In Lesson 9 and Lesson 10 we read one candle at a time. From this lesson on, we read candles in pairs. A single candle tells you what happened in one period; two candles side by side tell you whether the second period agreed with the first or overruled it. Engulfing and harami patterns are the two simplest ways the second candle can answer.
What they are: two bodies compared
Both patterns compare only the bodies (open to close), not the wicks:
| Pattern | Candle 1 | Candle 2 | Where it should appear | What it records |
|---|---|---|---|---|
| Bullish engulfing | Red (down) body | Green body that covers all of candle 1's body | After a fall | Buyers erased the whole of the previous period's selling, and more, in one period |
| Bearish engulfing | Green (up) body | Red body that covers all of candle 1's body | After a rise | Sellers erased the whole of the previous period's buying, and more |
| Bullish harami | Large red body | Small green (or neutral) body inside candle 1's body | After a fall | The selling slowed sharply; the market went quiet inside yesterday's range |
| Bearish harami | Large green body | Small red (or neutral) body inside candle 1's body | After a rise | The buying slowed sharply; the market paused inside yesterday's range |
"Harami" is an old Japanese word for pregnant: the large first candle "carries" the small second one. A harami whose second candle is a doji (Lesson 9) is called a harami cross and is read the same way, with the pause even more complete.
Why crypto changes the textbook rule
Candlestick books were written for stock markets that close every evening. There, an engulfing candle usually opens beyond the previous close (a gap) and then closes beyond the previous open. Crypto trades 24/7, so on Binance each daily candle opens at the previous candle's close, to the cent or very close to it. A crypto engulfing candle therefore never gaps; what matters is the close:
- Bullish engulfing in crypto: the second candle closes above the first candle's open.
- Bearish engulfing in crypto: the second candle closes below the first candle's open.
- Harami in crypto: the second candle's body stays inside the first body. Because it starts at the first candle's close, it begins at the edge of that body and must not close beyond the first candle's open.
In this course we also use two working rules: the engulfing body should be at least about 1.2 times the first body (a near-equal pair is weak), and a harami's second body should be no more than about half of the first. Volume on the second candle (from Lesson 1) is context, not a requirement.
How to spot them on a chart: nine real Bitcoin daily pairs
These are Binance BTC/USDT daily candles (UTC close). "Body ratio" is candle 2's body divided by candle 1's body.
| Pair | Candle 1 (open → close) | Candle 2 (open → close) | Body ratio | Volume, candle 2 vs 1 | Pattern | What followed |
|---|---|---|---|---|---|---|
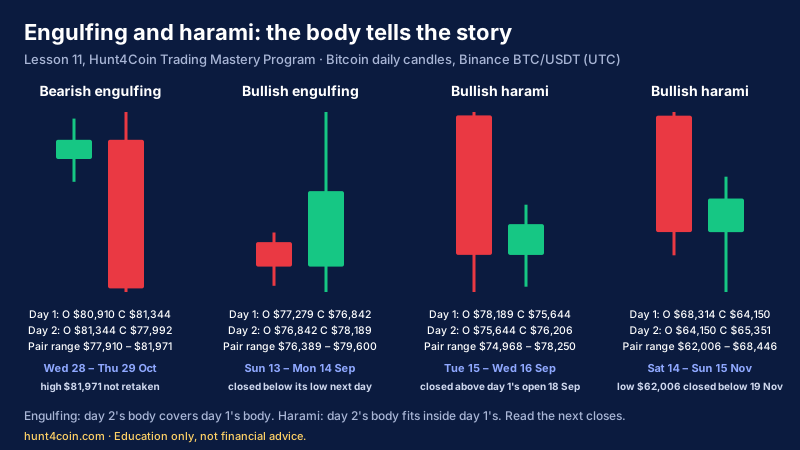
| 13–14 Sep | $77,278.73 → $76,842.01 | $76,842.01 → $78,189.21 | 3.1× | 2.2× | Bullish engulfing | Next day closed at $75,644.48, below the pair's low ($76,388.72) |
| 15–16 Sep | $78,189.20 → $75,644.48 | $75,644.48 → $76,206.01 | 0.22× | 0.7× | Bullish harami | 18 Sep closed at $80,883.87, above candle 1's open |
| 13–14 Oct | $81,850.01 → $83,169.00 | $83,169.01 → $81,682.01 | 1.1× | 1.2× | Bearish engulfing (weak, inside a range) | Next day traded to $79,800 but closed back at $82,245.93; no follow-through |
| 21–22 Oct | $83,028.14 → $84,093.42 | $84,093.42 → $81,416.09 | 2.5× | 1.2× | Bearish engulfing | The pair's high ($84,898) has not been traded since |
| 28–29 Oct | $80,909.77 → $81,343.50 | $81,343.51 → $77,991.89 | 7.7× | 1.8× | Bearish engulfing | The pair's high ($81,971) has not been traded since |
| 4–5 Nov | $77,453.85 → $80,504.01 | $80,504.01 → $76,088.01 | 1.4× | 1.2× | Bearish engulfing | The pair's high ($81,196.01) has not been traded since |
| 8–9 Nov | $75,867.58 → $74,851.44 | $74,851.44 → $75,368.41 | 0.51× | 1.7× | Bullish harami (borderline) | Next day closed at $73,796.06, below the harami |
| 14–15 Nov | $68,314.01 → $64,150.00 | $64,150.01 → $65,351.05 | 0.29× | 0.9× | Bullish harami | Four quiet days, then on 19 Nov a close at $61,986.73, below the pair's low ($62,006) |
| 15–16 Nov | $64,150.01 → $65,351.05 | $65,351.05 → $64,882.87 | 0.39× | 0.75× | Bearish harami | 18 Nov closed at $63,068.21, below candle 1's open |
Reading them the way a trader reviews past charts:
- 28–29 October, a textbook bearish engulfing. After a small green day (body $434), Bitcoin opened 29 October at $81,343.51, traded up to $81,971, then fell to close at $77,991.89, a 4.1% red body 7.7 times the previous one, on 82% more volume (23,832 BTC against 13,109). Every buyer from 28 October was underwater by the close. The pair's high of $81,971 became the line: on 4 November Bitcoin rallied to $81,196, below it, and has not traded above it since.
- 4–5 November, an engulfing after a bounce. On 4 November Bitcoin rose 3.9%, from $77,453.85 to $80,504.01. On 5 November it gave all of that back and more, closing at $76,088.01. Traders who read structure note where it appeared: just under the 29 October high, at the top of a bounce inside a falling market. That is the context in which engulfing patterns carry the most weight. As of 21 November, 05:00 UTC, the $81,196 high had not been revisited and Bitcoin was trading near $56,400, its lowest level since 2024 (see today's news). That is a description of what the chart did, not a reason to expect any particular next move.
- 13–14 September, a bullish engulfing that failed the next day. A strong green candle covered a small red one, on more than twice the volume. It looked convincing. The next day closed at $75,644.48, below the low of both candles. Big, clean patterns fail too; the close through the pattern's low is what tells you.
- 15–16 September, a harami that turned into a recovery. After a 3.3% fall on 15 September, the 16 September body was only 22% of it, on lower volume: the selling simply stopped. Two days later, on 18 September, Bitcoin closed at $80,883.87, above the first candle's open ($78,189.20). The harami did not predict that; it marked the pause, and the 18 September close was the confirmation.
- 13–14 October, an engulfing in the middle of a range. The bodies were almost the same size (1.1×), and Bitcoin had been moving sideways between about $81,000 and $84,000 for a week. The next day it traded to $79,800 and closed back above the pattern's close. A pattern in the middle of a range, with barely more body than the candle it "engulfs", is noise.
- 14–15 November, a harami that held for four days, then failed. After a 6.1% fall on 14 November, the Sunday candle stayed inside the red body. The next three candles also stayed in that range. On 19 November Bitcoin closed at $61,986.73, below the pair's low of $62,006 (the same low Lesson 10 discussed as a near-hammer). The pause ended in the direction of the larger trend.
- 15–16 November, a bearish harami inside a falling market. The small red body on 16 November sat inside the 15 November green body, a pause after a bounce. Two days later the close went below the 15 November open. When a harami points the same way as the bigger trend, traders treat it as a pause within that trend rather than a reversal signal.
Out of five engulfing pairs here, three were followed by price not returning to the pair's extreme, one failed the next day and one went nowhere. Out of four harami pairs, one resolved upwards and three resolved in the direction of the larger fall. Nine pairs are far too few to draw a statistic from; the point is that the outcome was always decided by later closes, never by the pattern alone.
How traders use them
- As a level, not a forecast. A bearish engulfing gives you a high (the highest price of the two candles); a bullish engulfing gives you a low. A harami gives you a range: candle 1's open and close. Traders mark these and watch how price behaves when it comes back to them.
- Location first. An engulfing pattern at a level that already mattered (a previous swing high, a round number, the top of a range) means more than one in the middle of nowhere. Support, resistance and market structure come in Module 3 of the Trading Mastery Program.
- Confirmation. Common rules: act on a bullish engulfing only if the next candle does not close below the pattern's midpoint; act on a harami only when price closes outside candle 1's body, in either direction. Many traders treat a harami as "wait", not "go".
- Compare with the bigger trend. Check the next timeframe up (Lesson 2). A bullish engulfing on a 4-hour chart inside a daily downtrend is a bounce candidate, not a trend change.
- Look at the size of the second body against recent candles. A 7.7× body like 29 October stands out against the previous ten days. A pair of small candles that happen to meet the definition says very little.
When they fail: common mistakes
- Using stock-market definitions on crypto. Waiting for a gap that 24/7 markets almost never print means you will never see an engulfing pattern, or you will invent one from wicks.
- Counting wicks. The definition compares bodies. A second candle whose wick covers the first candle but whose body doesn't is not an engulfing pattern.
- Ignoring the trend before it. A "bullish engulfing" after a rise is just a strong green day. The pattern needs something to reverse.
- Acting before the close. A daily candle that looks engulfing at 20:00 UTC can close back inside. On Binance the daily candle closes at 00:00 UTC.
- Treating a harami as a reversal. A harami shows a pause. Three of the four above resolved in the direction of the larger move.
- Forgetting that the same candle can be two things. The 9 November candle was a hammer in Lesson 10 and the second half of a harami here. Two names on one candle are one piece of evidence, not two.
Risk management
- Write the invalidation first. Bullish engulfing: a close below the pair's low. Bearish engulfing: a close above the pair's high. Harami: a close outside candle 1's body in the direction against your idea. Put the stop a little beyond that level, not inside the wicks.
- Size from the stop distance. Take the 15–16 September harami read as a pause after a fall: entry near the $76,206 close, stop just under the pair's low (about $74,900, roughly $1,300 away). Risking 1% of a $10,000 account ($100) gives about 0.077 BTC (about $5,840 of Bitcoin). The 4–5 November bearish engulfing, read by a futures trader with a stop just above the $81,196 high and entry near the $76,088 close (about $5,200 away), gives only about 0.019 BTC for the same $100 risk. Wide patterns mean small positions; leverage does not change the risk, it only changes the margin (Lesson 7).
- Plan exits as scenarios. Decide in advance what you will do if price reaches the last swing, if it goes sideways for three days, and if it closes back inside the pattern. These are rules written before the trade, not predictions.
- Remember the costs. On a $5,840 position, a 0.1% taker fee is about $5.84 each way, about 12% of a $100 risk for a round trip (Lesson 6). Very tight patterns on small timeframes can be eaten by fees and spread.
Practice drill with Hunt4Coin's free tools
- Open the Bitcoin chart on daily candles and find the nine pairs in the table. Check the opens and closes with the crosshair.
- For the last 90 daily candles, mark every pair where candle 2's body covers candle 1's (engulfing) or sits inside it (harami), using this lesson's 1.2× and 0.5× rules. Write the trend before each one.
- For each one, note whether the next three closes stayed beyond the pattern's level or went back through it. Do at least 20 examples before forming any view.
- Add volume under the chart and compare candle 2's volume with candle 1's.
- Use the crypto screener to pick three coins from the top 100 with RSI below 30 on the daily timeframe, and repeat step 2 on their 4-hour charts; compare with today's screener snapshot.
- Plan one paper trade on a pattern you find, with the stop beyond the pattern and size set to 1% of the paper balance, set a price alert at the invalidation level, and test a simple engulfing rule over months of data in the backtester with fees switched on.
FAQ
What is a bullish engulfing pattern in crypto? It is two daily (or other timeframe) candles where a red candle is followed by a green candle whose body covers the whole red body, formed after a fall. Because crypto trades 24/7, the second candle opens at the first one's close, so in practice it means the green candle closes above the red candle's open. Traders treat the low of the two candles as the level that should hold.
What is the difference between an engulfing and a harami pattern? They are opposites. In an engulfing pattern the second body is larger and covers the first, which shows one side overpowering the other. In a harami the second body is small and sits inside the first, which shows the move pausing. An engulfing pattern is read as a possible turn; a harami is read as a wait until price leaves the first candle's body.
Is a bearish engulfing pattern reliable? No single pattern is reliable on its own. On Bitcoin's daily chart in October and November 2026, three clear bearish engulfing pairs (22 October, 29 October, 5 November) were followed by price staying below their highs, while a weak one inside a range on 14 October was not. Context (a prior rise, a level that mattered, a large body) and the next closes decide the reading.
Lesson 11 summary
Two candles, two bodies. When the second body covers the first in the opposite colour, it is an engulfing pattern: one side took over. When the second body fits inside a large first body, it is a harami: the move paused. In crypto, judge it by the close, because the next candle always opens at the previous close. Look for a prior trend and a meaningful level, mark the pattern's high, low or range, wait for the next closes, and size the position from the distance to the invalidation.
Education only, not financial advice. Trading crypto, stocks, metals, oil or forex is risky; never trade money you can't afford to lose.