Doji, spinning top and marubozu
Published · Updated · by Hunt4Coin
A doji is a candle whose open and close are almost equal, a spinning top is a candle with a small body and wicks on both sides, and a marubozu is a candle that is nearly all body with little or no wick; together they describe the three basic states of a market in one period: undecided, hesitant, or firmly controlled by one side.
Lesson 9 of the Hunt4Coin Trading Mastery Program · Module 2: Candlesticks · Previous: Lesson 8, candle anatomy · Next: Lesson 10, hammer, inverted hammer and shooting star.
In Lesson 8 you learned to measure a candle: the body (open to close), the wicks (the prices traded but not kept) and the range (high to low). This lesson uses those measurements to name the three single-candle shapes you will see most often. They are not trading signals on their own. They are words for what happened in one period, and you will need them for every multi-candle pattern later in this module.
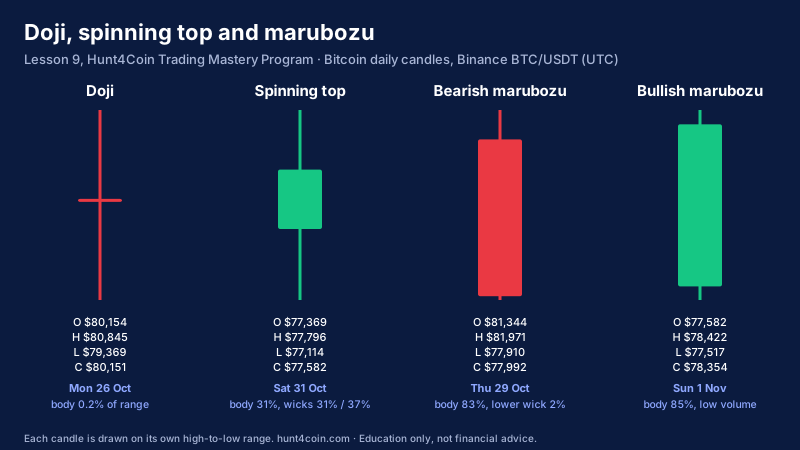
What they are: three shapes measured from the range
All three are defined by how big the body is compared with the candle's own range, and where the wicks are. Books disagree on exact thresholds, so in this course we use these working rules:
| Shape | Body as % of range | Wicks | What it describes |
|---|---|---|---|
| Doji | about 10% or less | Any; often on both sides | Open and close nearly equal: the period ended where it began |
| Spinning top | about 10% to 35% | On both sides, each at least as long as the body | Both sides moved price; neither kept control |
| Marubozu | about 80% or more | Very short or none | One side pushed from open to close and held it |
Colour matters little for a doji, more for a spinning top and a lot for a marubozu: a bullish marubozu is green (opens near the low, closes near the high) and a bearish marubozu is red (opens near the high, closes near the low).
Doji have named variants you will meet: a long-legged doji (long wicks both sides), a dragonfly doji (long lower wick, close near the high) and a gravestone doji (long upper wick, close near the low). They are the same idea, open equals close, with the wicks telling you where price went during the period.
How to spot them on a chart: four real Bitcoin daily candles
These are Binance BTC/USDT daily candles (UTC), measured from their open, high, low and close. Each one is drawn on its own range in the diagram above.
| Day | Open | High | Low | Close | Body (% of range) | Upper / lower wick | Volume (BTC) | Shape |
|---|---|---|---|---|---|---|---|---|
| Mon 26 Oct | $80,154.09 | $80,844.70 | $79,368.67 | $80,150.56 | $3.53 (0.2%) | 47% / 53% | 15,371 | Doji (long-legged) |
| Thu 29 Oct | $81,343.51 | $81,971.00 | $77,910.00 | $77,991.89 | $3,351.62 red (83%) | 15% / 2% | 23,832 | Bearish marubozu |
| Sat 31 Oct | $77,368.76 | $77,796.01 | $77,114.01 | $77,582.02 | $213.26 green (31%) | 31% / 37% | 6,288 | Spinning top |
| Sun 1 Nov | $77,582.02 | $78,422.23 | $77,517.20 | $78,354.00 | $771.98 green (85%) | 8% / 7% | 6,544 | Bullish marubozu |
Reading them as a trader would:
- 26 October, the doji. Bitcoin traded across a range of $1,476, from $79,369 to $80,845, and closed just $3.53 below where it opened. Buyers and sellers each pushed price about $700 to $780 away from the open, and the day ended in balance. The next two days closed higher ($80,910 on 27 October, $81,344 on 28 October). The doji did not say which way the market would go next; it only recorded a day of balance.
- 29 October, the bearish marubozu. Price opened at $81,344, barely rose, and then fell for the whole day to close $82 above its low. The body was 83% of a $4,061 range, and volume was about 82% higher than the day before (23,832 BTC against 13,109). That combination, a large body closing near its extreme on heavy volume, is what traders mean by one side in clear control. The next day traded lower again, to $76,326.
- 31 October, the spinning top. After two falling days, a Saturday candle with a body of $213 and wicks of $214 above and $255 below, inside a range of only $682, on the lowest volume of the four. It shows hesitation: the selling of the previous days slowed, but no one took control.
- 1 November, the bullish marubozu. A Sunday candle that opened near its low and closed near its high, body 85% of the range. It looks strong. But its range was only $905 and its volume (6,544 BTC) barely a quarter of 29 October's. On 2 November price fell to $76,705 and closed at $76,816, below the 1 November open of $77,582, erasing the whole candle in one day. Volume and context were telling the more important story.
Two more marubozu-like candles appeared during the fall into the weekend low of Lesson 8: 12 November (body 82% of a $3,104 range, close $71,460) and 13 November (body 80% of a $3,946 range, close $68,314 on 29,649 BTC, the heaviest volume of the two). Back-to-back large red bodies closing near their lows are how a strong one-sided move looks on a daily chart.
How traders use them
- Doji: a pause, read in context. After a long run in one direction, a doji shows that the push stopped for one period. Traders treat it as a reason to watch, not to act, and look at the next candle's close for direction. In a sideways range, doji are normal and mean very little.
- Spinning top: fading control. A spinning top after strong candles suggests the side in charge is losing momentum. Several in a row usually mean a range is forming.
- Marubozu: who is in control right now. A marubozu shows the period's winner clearly, especially when it breaks a level and closes beyond it on above-average volume. Many traders treat the marubozu's open (for a bullish one) or its high (for a bearish one) as the level that should hold if the move is real.
- Wicks still matter. A doji or spinning top that forms at an obvious level, such as a previous low, with a long wick through that level, is a rejection of that level for that period. You will see this grow into the hammer and shooting star next lesson.
When they fail: common mistakes
- Treating a doji as a reversal signal. The 26 October doji came before two rising days and then a large fall. A doji is balance, not direction.
- Ignoring volume. The 1 November marubozu looked as strong as the 29 October one, but on a quarter of the volume, on a Sunday, inside a small range. It was undone the next day.
- Ignoring the size of the range. A marubozu with a $900 range after days of $3,000 to $4,000 ranges is a small move with a neat shape. Compare each candle's range with the last 10 to 20 candles.
- Reading lower timeframes the same way. On 1-minute or 5-minute charts, doji and spinning tops appear constantly because little happens in each candle. The shapes carry more weight on 4-hour and daily charts.
- Forgetting the exchange and the close time. A daily doji on Binance (00:00 UTC close) can be a small green body on an exchange or chart that closes at a different hour. Read the chart you trade on.
- Naming the shape before the close. A candle that looks like a marubozu at 18:00 UTC can grow a long wick by 23:59. Wait for the close.
Risk management
- Let the candle define the invalidation. If you read a bullish marubozu as strength, the reading is wrong if price closes back below the candle's open, and clearly wrong below its low. Write that level down before any trade.
- Size from the stop. Take the 1 November candle: a trader reading it as strength, buying near the $78,354 close with a stop a little below the $77,517 low (about $900 away), risking 1% of a $10,000 account ($100), could hold about 0.11 BTC (about $8,700 of Bitcoin). On 2 November the stop was hit. The loss was the planned $100 plus fees, not the full drop. That is what sizing is for.
- Do not trade a doji by itself. If you act after a doji, act on the following candle's close beyond the doji's high or low, and place the stop on the other side of the doji.
- Mind the spread on quiet days. Weekend candles like 31 October and 1 November form on thin books, where stops fill worse (Lesson 4), and every entry and exit pays the fee (Lesson 6).
Practice drill with Hunt4Coin's free tools
- Open the Bitcoin chart on daily candles and find 26, 29 and 31 October and 1 November. Check the table's prices with the crosshair.
- For the last 30 daily candles, calculate body as a percentage of range and label each one doji, spinning top, marubozu or none, using this lesson's thresholds.
- Add volume below the chart. For every marubozu you found, compare its volume with the average of the previous 10 days and write "heavy" or "light".
- For each doji and marubozu, write what the next candle did (closed above the high, below the low, or inside). Do this for 20 examples before drawing any conclusion.
- Use the crypto screener to pick three coins from the top 100 and repeat step 2 on their 4-hour charts.
- Plan one paper trade using a marubozu's low as the invalidation, sized to 1% of the paper balance, and set a price alert at the candle's open. Then test the same rule over months of data in the backtester with fees switched on.
FAQ
What is a doji candle in crypto? A doji is a candle whose open and close are almost the same, so its body is tiny (about 10% of the range or less) and it looks like a cross. It shows the period ended in balance between buyers and sellers. On its own it does not predict a reversal; traders wait for the next candle's close.
What is the difference between a doji and a spinning top? Both show indecision. A doji's body is almost nothing; a spinning top has a small but visible body (roughly 10% to 35% of the range) with wicks on both sides at least as long as the body. A spinning top shows hesitation; a doji shows near-perfect balance.
Is a marubozu always a strong signal? No. A marubozu shows that one side controlled that period, but its weight depends on its range and volume compared with recent candles, and on where it forms. On 1 November 2026 a small, low-volume bullish marubozu on Bitcoin's daily chart was fully erased the next day.
Lesson 9 summary
A doji (open equals close) records balance, a spinning top (small body, wicks both sides) records hesitation, and a marubozu (nearly all body) records one side in control for that period. Measure them against the candle's own range, compare the range and volume with recent candles, and read them only after the close and in context. On Bitcoin's daily chart, the 26 October doji did not tell the direction, the 29 October bearish marubozu on heavy volume did show strong selling, and the light 1 November bullish marubozu was erased the next day. Next lesson: the hammer, inverted hammer and shooting star, where the wick becomes the message.
Education only, not financial advice. Trading crypto, stocks, metals, oil or forex is risky; never trade money you can't afford to lose.