Candle anatomy: open, high, low, close, body and wicks
Published · Updated · by Hunt4Coin
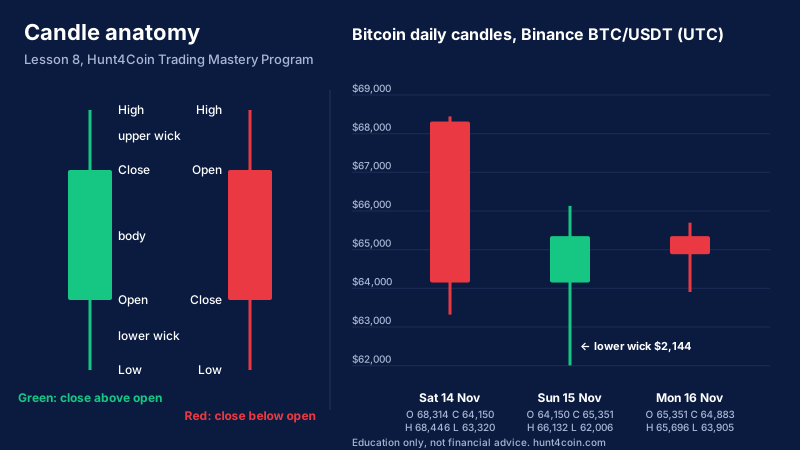
A candlestick shows four prices for one period of time: where price opened, the highest and lowest it traded, and where it closed; the thick part between open and close is the body, and the thin lines above and below it are the wicks (or shadows).
Lesson 8 of the Hunt4Coin Trading Mastery Program · Module 2: Candlesticks · Previous: Lesson 7, spot vs futures · Next: Lesson 9, doji, spinning top and marubozu.
Module 1 gave you the tools: what a chart is, timeframes, pairs, liquidity, orders, fees and leverage. Module 2 is about reading what price actually did, one candle at a time. Every candlestick pattern you will meet later (hammers, engulfing candles, morning stars) is just a description of bodies and wicks, so this lesson is the alphabet for the rest of the module. We will read it on three real Bitcoin daily candles from 14 to 16 November 2026.
What it is: the four prices and the three parts
Every candle summarises one period of the timeframe you chose: one minute, one hour, one day. Within that period the exchange records four prices, together called OHLC:
| Price | Meaning |
|---|---|
| Open | The first trade of the period |
| High | The highest trade of the period |
| Low | The lowest trade of the period |
| Close | The last trade of the period |
From those four numbers come the three parts of the candle:
- Body: the rectangle from open to close. It is green (or hollow) when the close is above the open, and red (or filled) when the close is below the open. Its size is |close − open|.
- Upper wick: the line from the top of the body to the high. Its size is high − max(open, close).
- Lower wick: the line from the bottom of the body to the low. Its size is min(open, close) − low.
The whole height, high − low, is the candle's range. Colour tells you who finished the period ahead; the body tells you by how much; the wicks tell you where price went and could not stay.
How to read each part
The body is the result. A large body relative to the range means price moved one way and stayed there: whoever was pushing kept control until the close. A small body means the period ended near where it began, whatever happened in between.
The wicks are the rejected prices. A long lower wick means sellers pushed price down during the period but buyers brought it back up before the close; the low was traded but not accepted. A long upper wick is the mirror: buyers reached a high that sellers pushed back down. Wicks are often where stop orders and liquidations were filled, because those orders sit just beyond obvious levels.
Ratios matter more than dollars. A $500 body means a lot on a quiet day and little on a $5,000-range day. Traders compare body and wick sizes to the candle's own range, and the range to recent candles.
The close matters most. Many traders treat the close as the most important of the four prices, because it is where the market settled when the period ended. A wick through a level shows that price visited it; a close through it shows that price stayed. On a daily chart in crypto the close is 00:00 UTC on most exchanges.
How to spot it on a chart: three real Bitcoin daily candles
Here are the Binance BTC/USDT daily candles (UTC) for the weekend fall and the day after, with the parts measured from OHLC:
| Day | Open | High | Low | Close | Body | Upper wick | Lower wick | Range |
|---|---|---|---|---|---|---|---|---|
| Sat 14 Nov | $68,314 | $68,446 | $63,320 | $64,150 | $4,164 red (81% of range) | $132 | $830 | $5,126 |
| Sun 15 Nov | $64,150 | $66,132 | $62,006 | $65,351 | $1,201 green (29%) | $781 | $2,144 (52%) | $4,126 |
| Mon 16 Nov | $65,351 | $65,696 | $63,905 | $64,883 | $468 red (26%) | $345 | $978 | $1,791 |
Reading them as a trader would:
- Saturday 14 November is a large red candle: the body is 81% of the range and the close sits close to the low. Sellers controlled the whole day, and there was little buying near the low. Volume was the highest of the three days, about 32,700 BTC on Binance. This was the day the leveraged longs from Lesson 7 started to be liquidated.
- Sunday 15 November opened where Saturday closed, traded down to $62,006 early in the day, and then closed $3,345 above that low, above its own open. More than half the range is lower wick. The low was traded and rejected: sellers could not keep price there. That is all the candle says. It does not say the fall is over.
- Monday 16 November is small: a body of $468 inside a $1,791 range, with wicks on both sides and lower volume (about 21,900 BTC). It shows a pause and indecision after two very active days, and it stayed above Sunday's low.
Notice one more thing: CoinGecko, which averages many exchanges, gave Sunday's low as about $62,200, while Binance printed $62,006. Wicks differ between exchanges, because each has its own order book and its own forced sellers. Always know which exchange's chart you are reading, especially when you place stops near a wick.
Candles inside candles
One daily candle is six 4-hour candles or 24 hourly candles. Sunday's long lower wick on the daily chart was, on Binance's hourly chart, two red hours (00:00 and 01:00 UTC) that fell from $64,150 to the low of $62,006, followed by one large green hour from 02:00 UTC that rose from $62,625 to close at $64,900. The daily chart compresses that story into one shape. This is why Lesson 2 suggests reading the higher timeframe for context and a lower one for detail: a single wick on the daily chart can be a whole trend on the 15-minute chart.
How traders use candle anatomy
- To judge strength. Large bodies closing near their extremes show one side in control; shrinking bodies after a run show that control fading.
- To find rejected levels. Long wicks mark prices the market visited and refused. Traders often mark the wick's end as a level to watch on later tests.
- To time decisions on the close. Instead of reacting to a move mid-candle, they wait for the candle to close and judge the finished shape.
- To read patterns later in this module. A hammer is a small body with a long lower wick; a marubozu is a body with almost no wicks; an engulfing candle is a body that covers the previous one. You now have the vocabulary.
When it fails: common mistakes
- Reading an unfinished candle. Until it closes, a candle is not a shape, just a moving price. At 02:00 UTC on Sunday the daily candle was red, $1,525 below its open at $62,625; it closed green 22 hours later.
- Ignoring context. A long lower wick in a strong downtrend is one rejection, not a reversal. Saturday's candle came after a month of lower lows.
- Ignoring volume. A wick on thin volume, such as a weekend hour, means less than the same wick on heavy volume.
- Mixing exchanges. Comparing one exchange's wick with another's stop level can leave a stop just inside a wick that "never happened" on your chart.
- Treating colour as the whole story. A tiny green candle after a big red one is not buying strength; the body size says how little changed.
Risk management
- Stops beyond wicks, not at them. If a level was defended by a long wick, many traders place stops a little beyond the wick's end rather than exactly at it, because the same area often gets tested again. The distance should come from the chart (for example, a fraction of the average range), not from a round number.
- Size from the stop. A stop beyond a $2,144 wick is far away, so the position must be smaller for the same risk. With a $10,000 account risking 1% ($100), a stop $2,500 away on Bitcoin allows a position of about $2,600 at $64,900, or about 0.04 BTC.
- Know your invalidation. If you read Sunday's wick as a rejection of $62,000, a daily close below $62,000 is the point at which that reading is wrong.
- Fees and spreads. Wick tips are where the spread is widest and fills are worst (Lesson 4); a stop filled there can slip beyond its price.
Practice drill with Hunt4Coin's free tools
- Open the Bitcoin chart on daily candles. Find 14, 15 and 16 November and check the table's open, high, low and close against the chart's crosshair.
- For each of the last ten daily candles, write the body, upper wick, lower wick and range, and the body as a percentage of the range. Mark every candle whose lower or upper wick is more than half its range.
- Switch the same chart to 1-hour candles and find the hours that built Sunday's lower wick (00:00 to 03:00 UTC on 15 November).
- Open the crypto screener and pick two coins that are oversold today; repeat step 2 on their daily charts and compare.
- Set a price alert at the end of the most recent long wick you found, and note what the next candle does when price returns there.
- Plan one paper trade with a stop beyond a wick, sized to risk 1% of the paper balance. Write the invalidation before you place it.
FAQ
What are the parts of a candlestick? A candle has a body, from open to close, and two wicks: the upper wick to the period's high and the lower wick to its low. Green means the close was above the open; red means below.
What does a long lower wick mean? Price traded down to that low during the period but closed well above it, so sellers pushed price lower and could not keep it there. It shows rejection of lower prices for that period; on its own it does not mean the trend has turned.
Why do candles look different on different exchanges? Each exchange has its own trades and order book, so highs and lows can differ, especially at fast moves. On 15 November 2026 Bitcoin's low was $62,006 on Binance and about $62,200 on CoinGecko's aggregate. Use the chart of the exchange you trade on.
Lesson 8 summary
A candle is four prices for one period: open, high, low and close. The body (open to close) is the period's result; the wicks are the prices traded but not kept; the close is where the market settled. Compare body and wicks to the candle's own range and to recent candles, read finished candles only, and always in the context of the trend and volume. On Bitcoin's daily chart, 14 November was a strong red body, 15 November a long lower wick that rejected $62,000, and 16 November a small pause. Next lesson: doji, spinning top and marubozu.
Education only, not financial advice. Trading crypto, stocks, metals, oil or forex is risky; never trade money you can't afford to lose.